

CSRD Waste Reporting: How to structure waste data across sites
Learn how to turn fragmented waste documentation into a consistent ESRS E5 compliant dataset for CSRD reports.
By now, CSRD has already been in place for several years and organisations are maturing in the way that they prepare these mandatory reporting cycles. In moving from planning to execution, waste is consistently one of the more operationally demanding areas to manage and report on effectively especially for large organisations with multiple sites because of the fragmentation across sites and service providers.
CSRD directive: what you need to know
The Corporate Sustainability Reporting Directive (CSRD) requires companies operating in the EU to disclose standardised sustainability data, including detailed information on resource use and waste under ESRS E5. It builds on previous frameworks such as the Non-Financial Reporting Directive (NFRD) and expands both the scope of companies affected and the level of detail required. For many organisations, the first reporting cycles are now underway, which means the focus has shifted from understanding the regulation to implementing processes that ensure data is complete, consistent and auditable across the business.
Why CSRD waste reporting is complex in practice
The data is there - it's generated and documented continuously across operations through:
- service orders
- invoices
- recycler and vendor reports
- internal tracking systems
And for large organisations this poses an extra challenge in that it's distributed across different locations, vendors and formats. Each reporting cycle requires bringing these inputs together and cleaning and structuring this raw data into something understandable. That preparation step is where most of the effort sits.
What CSRD requires for waste reporting (ESRS E5)
Under ESRS E5, organisations are expected to consistently report on core performance KPIs in a way that's comparable over time and across sites. These are the key waste KPIs as defined by ESRS E5.
- total waste volumes
- waste types and materials
- disposal methods (recycling, recovery, incineration, landfill)
- changes over time
- performance indicators such as recycling rates
The key step: structuring waste data for reporting
Preparing waste data for CSRD reporting involves a set of practical steps that are repeated across sites and reporting periods.
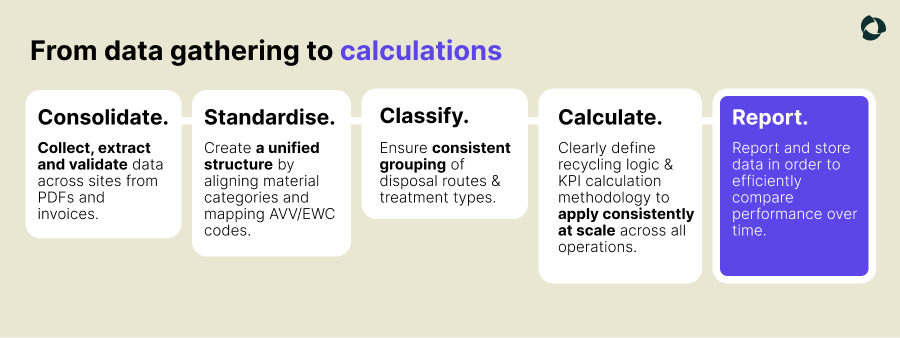
1. Consolidating data across sites
Building your master data set sounds easy enough but combining data from multiple locations across different waste vendors in varying formats from PDFs to spreadsheets to emails and data exports is messy. Recyclers are obligated to provide waste slips for every pick-up and for the most part they do and then most businesses receive quarterly or yearly summaries from them as well in addition to the data that they get through invoices. Combining and structuring this data is no easy feat. Extracting the data from all those sources into a single data set alone is a significant amount of work and then on top of that cross-checking the various data sources for duplicates and mismatched prices or weights and aligning kg vs tonnes and you start to get a picture about how complicated this first data extraction step can be in practice. This consolidation is such a big task that it's also incredibly prone to manual errors so on top of bringing everything together you also need to add some validation steps on top to make sure that everything is actually in fact accurate and plausible.
2. Standardising materials and waste categories
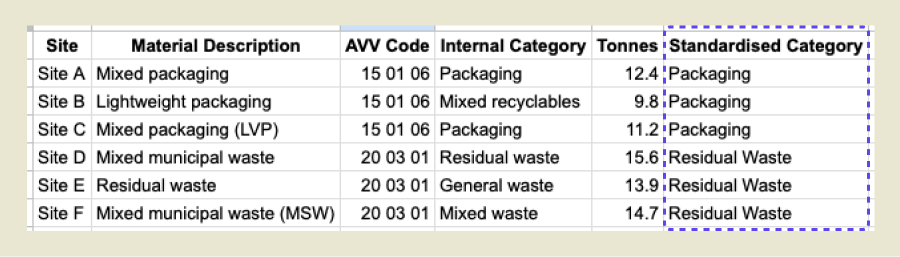
The next step is grouping waste into consistent categories across the organisation. The European Waste Catalogue (EWC) established a consistent framework for identifying different types of waste and each European country has their own way of version of what that means in the real world. (For Germany - it's AVV codes.) These 6 digit codes are standardised across the EU and while countries can have local naming or administrative variations, the codes themselves remain the same.
For example, 15 01 06 is the code for mixed packaging while 20 03 01 is for mixed municipal waste. And these mean the same thing whether a company is operating in Germany, the Netherlands or France. But even if these codes are standardised, they still don't fully solve the classification problem at this stage because they don't reflect how companies group materials for their reporting so organisations still need a consistent way to structure their data for reporting purposes. Without standardisation, the same material may appear under different labels making it difficult to reconcile data cleanly and accurately.
3. Classifying disposal routes
The same challenge applies to the classification of disposal routes. Here are the CSRD disposal route reporting standards as outlined by ESRS E5:
- Total waste split by hazardous vs. non-hazardous
- Treatment methods split into recycled, prepared for reuse, other recovery (eg. engergy recovery) and disposed of (eg. landfill, incineration without recovery)
- Material breakdowns including volumes by material or treatment types
- Geography or business unit breakdowns including volumes per material and treatment methods across locations
- Year on year comparisons
And as we stated before, recyclers are obligated to report on these points. Recycler reports provide detailed, transaction-level data for individual sites and vendors, but they are not structured for organisation-wide reporting. To use this data for CSRD, disposal routes need to be classified consistently across all inputs.
- Varying route descriptions: Similar disposal methods are labelled differently across vendors (eg. “energy from waste” vs “thermal recovery”), making direct comparison difficult.
- No predefined mapping to reporting categories: Disposal routes need to be consistently mapped into standard categories such as recycling, recovery or disposal to support CSRD reporting.
4. Applying consistent calculation logic
ESRS defines which KPIs need to be reported but allows businesses the liberty to define how they make those calculations. This final step in preparing your waste data for reporting involves defining and using a clear overarching strategy for calculating the main KPIs that get reported on. According to the regulation, these are the KPIs that need to be calculated and tracked across waste split, treatment methods, materials, location and time:
- Recycling rate
- Separation rate
- CO₂ savings / avoided emissions
- Raw materials saved
- Recovery vs disposal share
- Cost per tonne
- Waste volumes by treatment type
Each of these KPIs has their own nuance and can reported slightly differently ways and they're not created simply because waste data exists. They depend on rules such as:
- which disposal routes count as recycling
- how mixed or transformed materials are handled
- which factors are used for CO₂ and raw material calculations
- how costs and volumes are allocated across sites, materials or routes
Examples of how calculations can differ
Recycling rate
A recycling rate can change significantly depending on which treatment methods count as 'recycling' by definition. Some organisations count only material recycling and reuse. Others also include thermal recovery. That means two teams can report different recycling rates from the same waste dataset.
Separation rate
This depends on how “mixed waste” is defined. If one site classifies more streams as mixed or residual waste than another, the reported separation rate will differ even when collection performance is similar.
CO₂ savings
Avoided emissions are typically calculated using weight, route allocation and a material-specific CO₂ factor. The result changes when different emission factors are used, or when different assumptions are made about how much of a material goes to each disposal path.
Raw materials saved
This depends on the extraction factor assigned to a material. If one tonne of recycled material is assumed to replace 1.2 tonnes of virgin material in one setup and 1.0 in another, the reported result changes accordingly.
Recovery vs disposal share
This depends on how disposal routes are mapped. For example, “energy from waste” may be treated as recovery in one logic model and as disposal in another, which changes the treatment split and any downstream KPIs built on top of it.
Cost per tonne
This seems simple, but consistency still matters. Results change depending on whether all service costs are included, how partial loads are handled, and whether costs are grouped by site, material or container type.
How AI is changing waste reporting
All of these processes were traditionally handled through a combination of different tools, excel sheets and manual processes. And even though waste reporting is a rather small part of the overall CSRD reports with all these tools and processes it has undoubtedly become one of the most cumbersome bits. AI is well suited to solvingCSRD waste reporting because it can process large volumes of fragmented operational data, standardise it across sites and formats and apply consistent classification and calculation logic at scale.
The new Resourcify Insights product extracts structured data from documents such as invoices and reports, organises data into consistent format, maps it back to fully customisable and definable material and disposal route categories and prepares the dataset to be easily analysed according all the filters you might need.
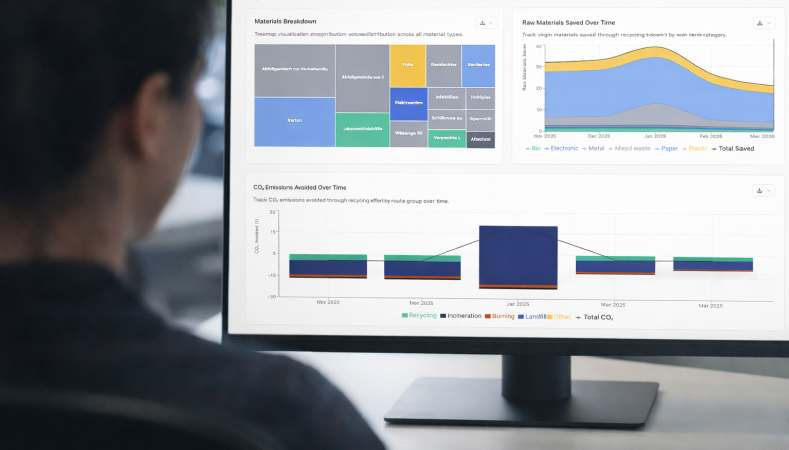
Real-time access to ESRS E5-relevant waste KPIs

To get an overview of previous periods, Resourcify's EasyDropAI allows new customers to simply upload all waste related documents in bulk pulling the data into a digital and structured format. And Resourcify Insights gives businesses full control as to how certain KPIs are captured, grouped and calculated. Once the setup is complete, recycler feedback is consistently fed into the system by email and all new data is structured according to your fully customised logic and made available in easy to use dashboard available for analysis or export at any time.
From waste data entry to waste ROI optimisation

Once waste data is structured consistently across sites, materials and disposal routes, it becomes possible to move beyond reporting and start using the data operationally. Instead of spending time consolidating inputs and aligning formats, teams can work with a unified dataset that supports analysis across the organisation. This makes it easier to identify patterns in waste volumes, understand where costs are driven, and compare performance between locations on a like-for-like basis.
In practice, this means waste data can be translated into concrete opportunities. For example, organisations can pinpoint sites with higher-than-average costs per tonne, identify materials with low recycling rates, or compare recycler performance across regions. As shown in the example above, structured data can be aggregated into a clear view of cost savings potential and environmental impact, highlighting where interventions such as improving sorting, renegotiating prices, or changing recycling pathways will have the greatest effect.
This shift changes the role of waste reporting. Instead of being a periodic exercise to meet reporting requirements, it becomes a continuous source of operational insight. With a consistent data foundation in place, organisations can prioritise actions, track improvements over time, and connect sustainability reporting with measurable business outcomes.
Key takeaway
CSRD waste reporting is not limited by data availability. Most organisations already have the necessary inputs across their operations. The challenge lies in turning that fragmented, operational data into a structured and consistent dataset that can be used reliably across sites and reporting periods. Building this foundation changes what waste reporting can deliver. It reduces the effort required for each reporting cycle and creates a dataset that can be used across compliance, operations and cost management.
As data preparation becomes more automated, the focus shifts towards using waste data to identify inefficiencies, improve performance and unlock measurable savings. This is where the real value lies - connecting reporting requirements with operational decision-making.


Trusted by


Get the latest insights delivered direct to your inbox
